


Report: U.S. clean power continues to grow as cancellations, gas development accelerate
The U.S. added 26 GW of clean power in the first half of 2026, while ~15 GW of projects were canceled, representing ~$24.5B in investment and ~68k construction jobs
Environmental Defense Fund and Atlas Public Policy today released a new report, The State of Clean Power in Q2 2026, finding that U.S. clean power continued to grow in the first half of the year, despite clean power project cancellations and more natural gas build out. The U.S. now has 489.6 gigawatts (GW) of operational clean power capacity, with another 211.7 GW planned or under construction through 2031.
“Rather than supporting the clean power needed to meet rising electricity demand, the Trump administration is actively impeding its deployment – canceling projects and clearing the way for costly fossil fuel buildout instead,” said David Villagrana, EDF’s Lead Counsel for Clean Energy Tax Solutions. “We should be removing barriers to affordable, reliable clean power, not slowing its progress.”
The report comes as U.S. electricity demand rises and federal actions create new obstacles for clean power development. Permitting restrictions and delays have stalled projects, while changes to federal tax credits have narrowed the window for wind and solar projects to qualify for incentives. Key findings from the report include:
- Clean power continues to grow. The U.S. added 26 GW of new clean power capacity in the first half of 2026, including 11.5 GW of solar, 8.3 GW of battery storage and 6.3 GW of wind. New wind and solar added during this period could generate enough electricity annually to power 5million U.S. homes.
- Solar and batteries dominate the clean power pipeline. Together, they account for roughly 87% of planned and under-construction clean capacity and an estimated $281 billion in future investment.
- Solar is poised to overtake wind as the largest source of U.S. clean power capacity in operation, capping a remarkable two-year rise.
- Clean power cancellations increased. Developers canceled 14.9 GW of planned or under-construction clean power capacity in the first half of 2026, with solar and battery projects accounting for almost all canceled capacity.
- Natural gas development accelerated. Planned and under-construction gas power capacity increased by 23.5 GW in the first half of 2026, from 44.8 GW at the end of 2025 to 68.3 GW. Fossil fuels accounted for 29% of planned power capacity by the end of Q2, up from 9% at the end of 2022.
- Clean power development is concentrated in a few states. 76% of existing, planned and under-construction clean power capacity is located in congressional districts represented by Republicans, dominated by Texas, Arizona, Oregon and California.
Figure 1: Additions of Clean Power Capacity (GW) by Year the Power Comes Online: Additions of Clean Power Capacity (GW) by Year the Power Comes Online
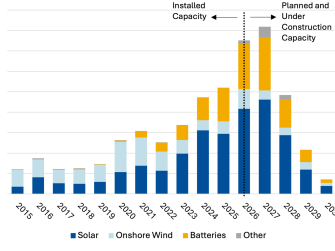
"Other” includes offshore wind, geothermal, and hydroelectric. Solar includes photovoltaic and thermal. Data as of June 2026. Source: Clean Economy Tracker
The analysis tracks operational, planned, under-construction and canceled clean power projects across the United States using data from the U.S. Energy Information Administration compiled through Atlas Public Policy’s Clean Economy Tracker. Additional reports and analysis from EDF’s clean power and clean energy manufacturing series are available at https://www.edf.org/state-us-clean-energy.
Read the full report: The State of Clean Power in Q2 2026
With more than 3 million members, Environmental Defense Fund creates transformational solutions to the most serious environmental problems. To do so, EDF links science, economics, law, and innovative private-sector partnerships to turn solutions into action. edf.org
Related Expert

Lead Counsel Clean Energy Tax Solutions
Latest press releases
-
Figure 1: Additions of Clean Power Capacity (GW) by Year the Power Comes Online: Additions of Clean Power Capacity (GW) by Year the Power Comes Online
September 28, 2026 -
Reports: Trump administration is moving to weaken fuel economy standards for new cars and trucks
September 26, 2026 -
Western electricity market appoints independent board, as momentum grows
September 25, 2026 -
Arizona Corporation Commissioner requests review of utilities’ billion-dollar electricity market decisions
September 24, 2026 -
Governor Newsom announces major step toward the linkage of California and Washington state Cap-and-Invest programs
September 23, 2026 -
Coming soon: Trump administration poised to weaken national methane protections
September 23, 2026